Taking part in public tenders: What does it actually cost, and where is there room for improvement?
A structured overview of the process, the four main components that make it up, and the potential for optimisation that few organisations exploit
If your company actively participates in public tenders, you probably feel that the process consumes a great deal of time and resources. This is not merely a subjective perception: it is a reality, as the process, by its very nature, involves demanding management, cross-departmental coordination, strict deadlines and a significant administrative burden that, in many cases, starts practically from scratch.
What few organisations have rigorously quantified is exactly how much time is spent on each part of that process, at which specific points inefficiency is most pronounced, and what actual return can be achieved when optimisation is approached methodically.
In this blog, we will attempt to answer these questions in a rigorous and practical manner: providing specific data on times per phase, identifying the tools available on the market for each stage of the process, and quantifying the savings achievable when a professionalised approach is applied.
We will be publishing a series of blog posts delving deeper into each phase, and by the end, you will have a complete overview of where time is spent, what can be optimised and how, and how much those savings can amount to in terms of operational capacity and actual cost per case.
A cross-cutting process that is complex by nature
Managing a public tender is not a one-off task. It is a structured process that simultaneously involves a wide range of roles within the company: the sales or business development team, the technical team that prepares the bid, the legal or administrative department that handles the documentation, and senior management, which approves strategic decisions regarding participation.
Added to this is the fact that each tender has its own specifications, its own evaluation criteria and its own deadlines. The range of scenarios is vast: a tender for technology services is not prepared in the same way as one for civil engineering works or the supply of equipment. There is no completely standardised process, although there is a structure comprising blocks common to practically all tender dossiers.
It is precisely within this structure that the most frequent patterns of inefficiency are found and, consequently, the greatest opportunities for improvement.
The actual cost: over 38 hours per case
When the time spent managing a tender of medium complexity—from start to finish—is analysed in detail, the result surprises even the most experienced teams: the total effort amounts to around 38 hours of actual work per tender.
This may seem manageable on an ad hoc basis. The problem arises when the actual volume of activity is considered: a company actively participating in tenders manages several dossiers simultaneously throughout the year, and this effort is repeated almost in its entirety for each one.
If the organisation participates in 20 tenders a year, the total cost exceeds 760 hours of work dedicated exclusively to this process. To this must be added the opportunity cost: the time of qualified professionals that could be allocated to other, higher-value activities.
The relevant question is not whether that time is a lot or a little. The question is how much of that time is strictly necessary and how much is due to inefficiencies that can be corrected.
The four main stages of the tender process
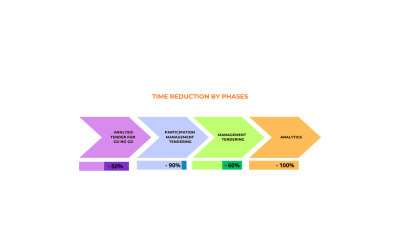
Before examining each phase in detail, it is useful to take a broad view. The tender management process can be divided into four main functional areas, each with its own set of activities, resources involved and potential for optimisation:

These four stages are not isolated from one another: they are linked in sequence, and the decisions made at each stage directly influence the work of the next. Stage 2—Participation Management—accounts for almost half of the total time and is where the biggest bottlenecks occur, but its efficiency depends largely on how Stage 1 has been managed.
What will your organisation find in each section?
Each of these four groups presents different realities in terms of complexity, automatability and the return on improvement. To give you a preview:

The savings percentages shown are estimates based on analyses of real-world processes and represent the potential achievable through an optimised approach. In the articles within each section, we will detail the methodology and the specific levers for improvement.
Not every part of the process can be optimised to the same extent
One of the most important conclusions to emerge from the detailed analysis is that the potential for improvement is not evenly distributed. There are activities where the right tools can reduce the time spent by between 40% and 60%; and there are others where human judgement is irreplaceable and automation plays only a marginal role.
The activities with the greatest potential for improvement share common characteristics:
Searching for, filtering and classifying information from multiple external sources.
Coordination and exchange of documentation between departments with differing schedules.
Generation and management of structured or partially standardisable documentation.
Simultaneous monitoring of the status of multiple cases and their deadlines.
Consolidation and analysis of historical data on participation and results.
At the other end of the spectrum, activities such as the strategic reading of tender documents, the preparation of a distinctive technical proposal or contractual negotiation require the involvement of qualified professionals and are not suitable for automation.
A precise understanding of this distinction is the basis for making sound investment decisions: it is not about technology for technology’s sake, but about clearly identifying where time is wasted unnecessarily and where methodological improvements and the right tools restore real operational capacity to the organisation.
What this series will cover
In the coming articles, we will analyse each of the four blocks in depth. For each one, we will examine:
- What the block consists of and what specific activities it encompasses.
- What resources and skill sets are required to execute it correctly.
- What tools and solutions are available on the market that can optimise it.
- How much time is spent on average and on which specific activities.
- What percentage of that time could be reduced and through which levers.
The final article in the series will consolidate all the data: total time per tender type, cumulative savings potential per block, and what that improvement represents in terms of capacity, cost and competitiveness for an organisation actively involved in tendering.
The data on times and savings percentages presented in this series are derived from the analysis of real tender management processes in companies across different sectors and of varying sizes. The figures represent indicative average estimates and may vary depending on the complexity of each tender, the sector and the maturity of the management team
You might also be interested in